Note
Go to the end to download the full example code.
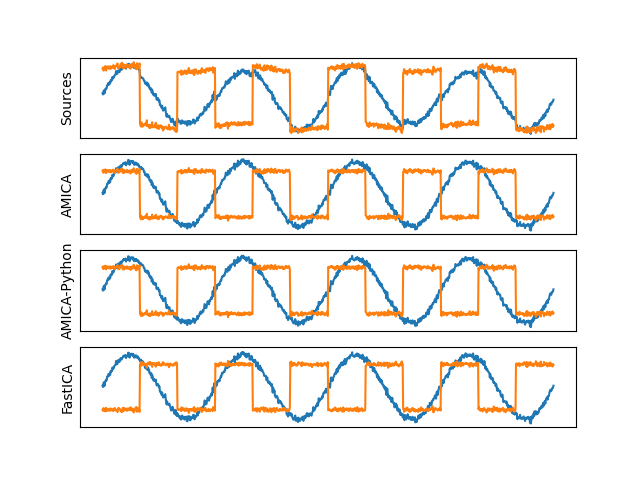
Run ICA On Toy Data#
Generate Data and Load AMICA Results for Comparison#
%%
data_dir = amica.datasets.data_path() / "toy_2" / "amicaout_toy_2"
Downloading data from 'https://github.com/scott-huberty/amica/releases/download/v0.6.0/test_output.tar.gz' to file '/home/circleci/amica_test_data/74cd649d03dc20d7b938945e84c7c5cd-test_output.tar.gz'.

  0%|                                              | 0.00/4.82M [00:00<?, ?B/s]
  0%|                                              | 0.00/4.82M [00:00<?, ?B/s]
100%|█████████████████████████████████████| 4.82M/4.82M [00:00<00:00, 15.5GB/s]
Untarring contents of '/home/circleci/amica_test_data/74cd649d03dc20d7b938945e84c7c5cd-test_output.tar.gz' to '/home/circleci/amica_test_data/.'
x = amica.utils.generate_toy_data(n_samples=10_000, noise_factor=.05, seed=42)
Run AMICA and FastICA for comparison#
fi = FastICA()
z = fi.fit_transform(x)
Finished in 8.55 seconds
apply the learned unmixing matrix to the data
Plot Results#
Total running time of the script: (0 minutes 13.434 seconds)