Note
Go to the end to download the full example code.
Sphering (whitening) data#
import numpy as np
import matplotlib.pyplot as plt

from amica.linalg import pre_whiten
This example heavily borrows from this great tutorial.
Toy Data#
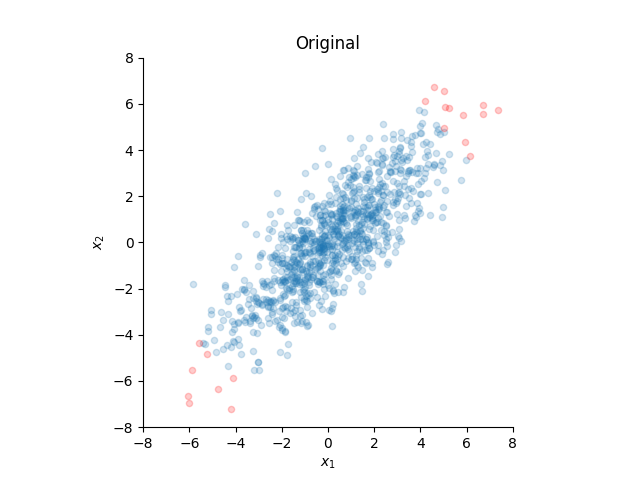
Generate toy 2D Gaussian data with correlated dimensions
rng = np.random.default_rng(seed=2)
mu = [0, 0]
sigma = [[5, 4], [4, 5]]  # must be positive semi-definite
n = 1000
X = rng.multivariate_normal(mu, sigma, size=n).T # shape (n, 2)
Highlight 20 farthest points from the origin
idx_far = np.argsort(np.linalg.norm(X, axis=0))[-20:]
idx_rest = list(set(range(n)) - set(idx_far))
Utility plotting function
def plot_data(data, title):
    fig, ax = plt.subplots()
    ax.scatter(data[0, idx_rest], data[1, idx_rest], s=20, alpha=0.2)
    ax.scatter(data[0, idx_far], data[1, idx_far], s=20, c="red", alpha=0.2)
    ax.set_aspect("equal")
    ax.set_xlim(-8, 8)
    ax.set_ylim(-8, 8)
    ax.set_xlabel("$x_1$")
    ax.set_ylabel("$x_2$")
    ax.spines["top"].set_visible(False)
    ax.spines["right"].set_visible(False)
    ax.set_title(title)
Original correlated data
plot_data(X, "Original")
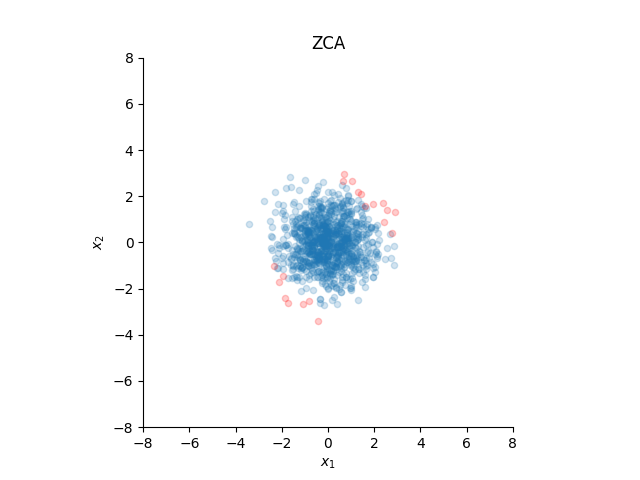
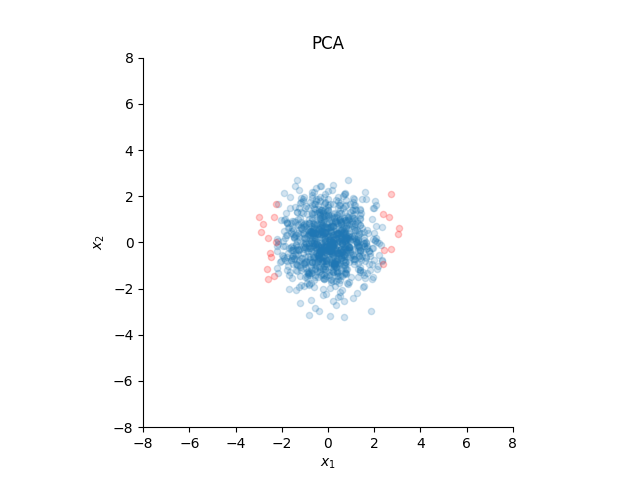
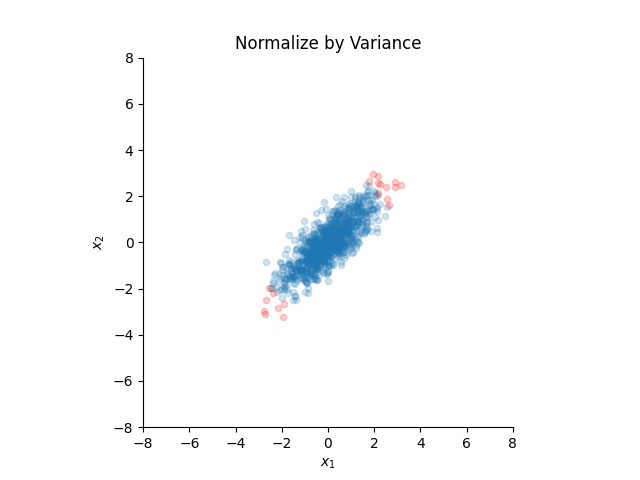
Whitening with different options#
Total running time of the script: (0 minutes 0.444 seconds)